CBSE Class 12

NCERT Solutions for Class 12 Geography Chapter 4 Use of Computer in Data Processing and Mapping

Detailed, Step-by-Step NCERT Solutions for Class 12 Geography Chapter 4 Use of Computer in Data Processing and Mapping Questions and Answers were solved by Expert Teachers as per NCERT (CBSE) Book guidelines covering each topic in chapter to ensure complete preparation. https://mcq-questions.com/ncert-solutions-for-class-12-geography-chapter-4-part-c/

Use of Computer in Data Processing and Mapping NCERT Solutions for Class 12 Geography Chapter 4

Use of Computer in Data Processing and Mapping Questions and Answers Class 12 Geography Chapter 4

Question 1.
Choose the correct option for the alternatives given below :
(i) What type of graph would you use to represent the following data

StatesShare of Production of Iron-ore (in%)
Madhya Pradesh23.44
Goa21.82
Karnataka20.95
Bihar16.98
Odisha16.30
Andhra Pradesh0.45
Maharashtra0.44

(a) Line
(b) Multiple Bar Graph
(c) Pie Diagram
(d) None of the above
Answer:
(c) Pie Diagram

NCERT Solutions for Class 12 Geography Chapter 4 Use of Computer in Data Processing and Mapping

(ii) Districts within a state would be represented in which type of spatial data?
(a) Points
(b) Lines
(c) Polygons
(d) None of the above
Answer:
(a) Points

(iii) Which is the operator that is calculated first in a formula given in a cell of a worksheet?
(a) +
(b) –
(c) /
(d) x
Answer:
(d) x

(iv) Function wizard in Excel enables you to
(a) Construct graphs
(b) Carryout mathematical/statistical operations
(c) Draw maps
(d) None of the above
Answer:
(a) Construct graphs.

NCERT Solutions for Class 12 Geography Chapter 4 Use of Computer in Data Processing and Mapping

Question 2.
Answer the following questions in about 30 words:

(i) What are the functions of different parts of a computer?
Answer:
A computer is very fast and versatile machine. This machine can perform simple arithmetic operations such as addition, subtraction, division and multiplication and this can also solve mathematical formulas. It can be used for data processing, preparation of diagrams, graphs and maps etc.

(ii) W’hat are the advantages of using computer over manual methods of data processing and representation?
Answer:
Computer saves times and improve efficiency in data processing and graphical presentation. Computer is more versatile as it facilitates the on screen editing the text copy and move it from one place to another or even delete the unwanted material. It can handle a large volume of the data and it further enables, validation, checking and correction etc.

(iii) What is a worksheet?
Answer:
MS Excel is also called spread sheet. It is the work-sheet. The spread-sheets are located in workbooks or excel fiels. Excel worksheet contains 16384 rows and 256 columns.

Question 3.
Answer the following questions in about 125 words:
(i) What is differences between spatial and non-spatial data? Explain with examples.
Answer:
Spatial Data. The spatial data represent a geographical space. They are characterised by the points, lines and the polygons. The point data represents positional characterstics of the some of the geographical features such as schools, hospitals, wells, villages, towns etc.
Non-Spatial Data. The data describing data is called as non-spatial or attribute data. For e.g. if you have a map showing positional location as the name of the school, number of the students in each the calss etc. In other words you will be defining the attributes of the spatial data.
NCERT Solutions for Class 12 Geography Chapter 4 Use of Computer in Data Processing and Mapping

(ii) What is the three forms of geographical data?
Answer:
The geographical data is available in analogue or digital form.
Uses of computer. The mapping software mapping software provides functions for spatial and attribute data input through one screen digitation of scanned maps. A digitation map consists of three files. The extention of these files are shp, shx and def. The def is dbase file that contains attributes data and is linked to shx and shp files.

NCERT Solutions for Class 12 Geography Chapter 4 Use of Computer in Data Processing and Mapping Read More »

NCERT Solutions for Class 12 Geography Chapter 3 Graphical Representation of Data

Detailed, Step-by-Step NCERT Solutions for Class 12 Geography Chapter 3 Graphical Representation of Data Questions and Answers were solved by Expert Teachers as per NCERT (CBSE) Book guidelines covering each topic in chapter to ensure complete preparation. https://mcq-questions.com/ncert-solutions-for-class-12-geography-chapter-3-part-c/

Graphical Representation of Data NCERT Solutions for Class 12 Geography Chapter 3

Graphical Representation of Data Questions and Answers Class 12 Geography Chapter 3

Question 1.
Choose the right answer from the four alternatives given below:
(i) Which one of the following map shows the population distribution?
(a) Choropleth maps
(b) Isopleth maps
(c) Dot maps
(d) Square root map
Answer:
(c) Dot maps

NCERT Solutions for Class 12 Geography Chapter 3 Graphical Representation of Data

(ii) Which one of the following is best suited to represent the decadal growth of population?
(a) Line graph
(b) Bar diagram
(c) Circle diagram
(d) Flow diagram
Answer:
(a) Line graph

(iii) Polygraph is constructed to represent:
(a) Only one variable
(b) Two variables only
(c) More than two variables
(d) None of the above
Answer:
(c) More than two variables

(iv) Which one the following maps is known as ‘Dynamic Map’?
(a) Dot Map
(b) Choropleth
(c) Isopleth
(d) Flow Map
Answer:
(d) Flow Map

NCERT Solutions for Class 12 Geography Chapter 3 Graphical Representation of Data

Question 2.
Answer the following questions in about 30 words:
(i) What is thematic map?
Answer:
A thematic map is a map specifically designed to show a particular theme connected with a specific geographic area. A thematic map is a map that focuses on a specific theme or a subject area.

(ii) Differentiate between multiple bar diagram and compound bar diagram.
Answer:
Bar diagram: The bar diagrams are drawn through columns of equal width. It is also called a column diagram. Compound bar diagram: When different components are grouped in one set of variable or different variables of one component are put together, their representation is made by a compound bar diagram. In this method different variables are shown in the single bar with different rectangles.

(iii) What are the requirements to construct a dot map?
Answer:
Requirements to construct a dot map are:

  • An administrative map of the given area showing state/district/block boundaries.
  • Definite and detailed data of the element.
  • Selection of a scale to determine the value of a dot.
  • Physiographic map of region especially relief and drainage maps.

(iv) Describe the method of constructing a traffic flow map.
Answer:
A traffic flow map can be drawn on some basis. These are following:
1. A route map depicting the desired transport routes along with the connecting stations.

2. The data pertaining to the flow of goods, number of the vehicles etc. along with the point of origin and destination of the movements.

3. The selection of a scale through which the data related to the quantity, passengers, goods and number of vehicles is to be represented.

NCERT Solutions for Class 12 Geography Chapter 3 Graphical Representation of Data

(v) What is an isopleth map? How an interpolation is carried out?
Answer:
Isopleth map. Isopleths are imaginary lines of equal value, in the form of quantity intensity and density. The word isos means equal and plethron means measure. Therefore, isopleths are lines of equal value. These Hues connect all the places with similar values.
Interpolation is carried out in the following method.

  • Firstly determine the minimum and maximum values given on the map.
  • Calculating the range of value.
  • Based on range determine the interval in a whole number like 5, 10, 15 etc.
  • The exact point of drawing an isopleth is determined by using following formula

Point of Isopleth
\(=\frac{\text { Distance between two points in } \mathrm{cm}}{\text { Distance between the two values }} \times \text { Interval }\)

(vi) Describe and illustrate important steps to be followed in preparing a choropleth map.
Answer:
The following steps are to be followed in preparing a choropleth map:

  • Arrange the data in ascending or descending order.
  • Group the data in five categories to represent very high, high and medium, low and very low.
  • The interval between the categories may be identified on the following formula
    i.e., range / 5 and range = Maximum value – Minimum value.
  • Patterns, shades or color to be used to depict the choosen categories should be maked in an increasing or decreasing order.

NCERT Solutions for Class 12 Geography Chapter 3 Graphical Representation of Data

(vii) Discuss important steps to represent data with the help of a pie-diagram.
Answer:
1. Arrange the data in an ascending order.
2. Calculate the degrees of angles showing the given values.
3. Plot the data dividing the circle into the required number of divisions.
4. Select a suitable radius for the circle to be drawn.
5. Draw a line from the centre of the circle to the arc as a radius.
6. Measures the angles from the arc of the circle for each category of vehicle in an ascending order clockwise starting with smaller angle.

NCERT Solutions for Class 12 Geography Chapter 3 Graphical Representation of Data Read More »

NCERT Solutions for Class 12 Geography Chapter 2 Data Processing

Detailed, Step-by-Step NCERT Solutions for Class 12 Geography Chapter 2 Data Processing Questions and Answers were solved by Expert Teachers as per NCERT (CBSE) Book guidelines covering each topic in chapter to ensure complete preparation. https://mcq-questions.com/ncert-solutions-for-class-12-geography-chapter-2-part-c/

Data Processing NCERT Solutions for Class 12 Geography Chapter 2

Data Processing Questions and Answers Class 12 Geography Chapter 2

Question 1.
Choose the correct answer from the four alternatives given below:
(i) The measure of central tendency that does not get affected by extreme values.
(a) Mean
(b) Mean and Mode
(c) Mode
(d) Median
Answer:
(d) Median

NCERT Solutions for Class 12 Geography Chapter 2 Data Processing

(ii) The measure of central tendency always coinciding with the hump of any distribution is
(a) Median
(b) Median and Mode
(c) Mean
(d) Mode
Answer:
(b) Median and Mode

(iii) A scatter plot represents negative correlation if the plotted values run from
(a) Upper left to lower right
(b) Lower left to upper right
(c) Left to right
(d) Upper right to lower left
Answer:
(a) Upper left to lower right

Question 2.
Answer the following question
(i) Define the mean.
Answer:
Mean or average is a quotient of the sum of several quantities. It is a number that by and large represents a series of numbers so, average can be taken as the central value or tendency of the population, in this case, all the students of your class.

NCERT Solutions for Class 12 Geography Chapter 2 Data Processing

(ii) What are the advantages of using mode?
Answer:
Advantages of using mode are –

  • It is easy to understand and simple to calculate.
  • It is not affected by extremely large or small values.
  • It can be located first by inspection in ungrouped data and discrete frequency distribution.
  • It can be useful for qualitative data.
  • It can be computed in an open end frequency table.

(iii) What is dispersion?
Answer:
Dispersion refers to the scattering of scores about measure of central tendency. Dispersion is also used to measure the extent to which individual items or numerical data tend to vary or spread about an average value. So, dispersion is the degree of spread or scatter or variation of measures about a central value.

(iv) Define correlation.
Answer:
Two variables are said to be correlated if the change of one variable results in a corresponding change in the other variable. The first variable causing a change of second variable is known as independent variable (X) and the other variable is known as dependent variable (Y). As estimation of the strength and direction of the association between two variables is called simple or bivariate correlation.

(v) What is perfect correlation?
Answer:
Perfect correlation is a relationship between two variables in which both variables move in tandem. A positive correlation exists when one variable decreases as the other variable decreases, or one variable increases while the other increases. The maximum degree of correspondence or relationship goes up to 1 tone in mathematical terms. On adding an element of the direction of correlation it spreads the maximum extent of-1 to +1 through zero. It can never be more than one correlation if 1 is known as perfect correlation.

NCERT Solutions for Class 12 Geography Chapter 2 Data Processing

(vi) What is the maximum extent of correlation?
Answer:
The maximum extent of correlation is l(one) in mathematical term. It can never be more than one.

Question 3.
Answer the following questions in about 125 words.
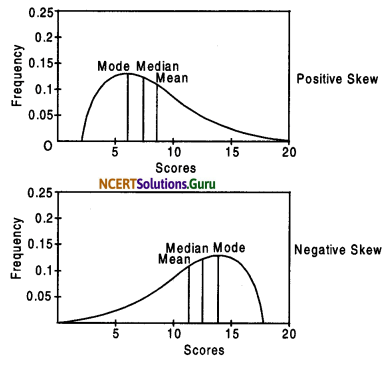
(i) Explain relative position of mean, median and mode in a normal distribution and skewed distribution with the help of diagrams.
Answer:
The three measures mean, median and mode of the central tendency could easily be compared with the help of normal distribution curve which is given below
NCERT Solutions for Class 12 Geography Chapter 2 Data Processing 1

The normal distribution has an important characteristic. The mean, median, mode are the same score because a normal distribution is symmetrical. The score with the highest frequency occurs in the middle of the distribution and exactly half of the scores occur above the middle and half of the scores occur below.

Most of the scores occur around the middle of the distribution of the mean. Very high and very low scores do not occur frequently and are, therefore, considered rare. If the data are skewed or distorted in some way the mean, median and mode will not coincide and the effect of the skewed data needs to be considered in the following figure.
NCERT Solutions for Class 12 Geography Chapter 2 Data Processing 2
(ii) Comment on the applicability of mean, median and mode. (Hint from their merits and demerits)
Answer:
Mean, median and mode are applicable as their advantages are

  • Simplicity: This is simple of all the measures of central tendency.
  • Representative value: This is based on the items in a series and is, therefore, a representative value of different items.
  • Certainty: Arithmetic mean is a value. It has no scope for estimated values.
  • Stability: Arithmatic mean has a stable value. The changes in he values of samples do not effect it.
  • Fair values: It balances the values of entire distribution.

NCERT Solutions for Class 12 Geography Chapter 2 Data Processing

Median:

  • This is difinite.
  • Median is easy to calculate and understand median.
  • Median can also be determined graphically.
  • It is not affected in the absence of anyone of the item.
  • It is helpful in qualitative facts such as ability, stability etc.

Mode:

  • Mode is simple precise and easy to understand.
  • It can be located on graph.
  • It cannot be given further mathematical treatment.
  • This is not affected by extreme items becasue it is not based on every item of the series.

(iii) Explain the process of computing standard deviation with the help of an in aginary example.
Answer:
Standard deviation is the square root of the arithmetic mean of the square of deviation of the items from their mean value. It is precise measure of dispersion and is denoted by a greek letter (small sigma) Computation of Standard Deviation Following formula is used to calculate the standard deviation for ungrouped data:
\((\text { sigma }) \sigma=\sqrt{\frac{\Sigma(\mathrm{X}-\overline{\mathrm{X}})^{2}}{\mathrm{~N}}}\)
where σ = standard deviation (S.D)
\(\Sigma(\mathrm{X}-\overline{\mathrm{X}})^{2}\)= sum total of squares of deviation.
N = Number of items.
The above formula becomes rather tendious if the value of X involves decimal points and also if the number of observations is very large. We may then use following short cut method:
\(\sqrt{\frac{\Sigma X^{2}}{N}-\left(\frac{\Sigma \bar{X}}{N}\right)^{2}}\)
Example – Following table shows the rainfall figures of last ten years. Calculate the standard deviation.

Standard Deviation Calculator is a free online tool that displays mean, variance, and standard deviation for the given set of data.

NCERT Solutions for Class 12 Geography Chapter 2 Data Processing

Year12345678910
Rainfall (in cm)10090120110807015013050100

(iv) Which measure of dispersion is the most unstable statistic and why?
Answer:
It can be observed that the mean derived from the two data sets given as under is same i.e. 50. The highest and the lowest score shown as above table. A 55 and 45 respectively. The distribution in table B has a high score of 98 and a low score of zero. The range of first distribution is 10 whereas it is 98 in the second distribution. Although the mean for both the groups is same, the first group is obviously stable or homogenous as compared to the distribution of score of the second group which is highly unstable or heterogeneous.

A. Scores of Individual

IndividualScores
XI52
X255
X350
X448
X545

B. Scores of Individual

IndividualScores
XI28
X200
X398
X455
X569

NCERT Solutions for Class 12 Geography Chapter 2 Data Processing

(v) Write a detailed note on the degree of correlation.
Answer:
When reference has been made about the direction of correlation, negative or positive a natural curiosity arises to know the degree of correspondence or association of the two variables. The maximum degree of correspondence or relationship goes upto 1 (one) in mathematical terms. It can never be more than one.

Correlation of 1 is known as perfect correlation (whether positive and negative). Between the two points of divergent perfect correlation lies 0 (zero) correlation a point of correlation or absence of any correlation between the variables.

(vi) What are various steps for the calculation of rank order correlation?
Answer:
The following steps are as under for the calualtion of rank order correlation:

  • Copy the data related to X-Y variable given in the excercise and put them in the first and second column of the table.
  • Both the variables are to be ranked separately. The ranks of X-variable are to be recorded in third column headed by XR
    (Rank-x). Similarly the ranks of Y-variables (YR) are to be recorded in the fourth column.
  • Now since both XR and YR have been obtained find the difference between two sets of ranks and record it in the fifth column.
  • Each of these difference is squared and sum of the column of square is obtained. This value is placed in sixth column.
  • Then the computation of the rank correlation is done by the application of the following equation:

\(\mathrm{P}=\frac{6 \Sigma \mathrm{D}^{2}}{\mathrm{~N}\left(\mathrm{~N}^{2}-1\right)}\)
Where P = Rank correlation
ΣD2 = Sura of the squares of the difference between two sets of ranks.
N = The number of Pairs of X-Y

NCERT Solutions for Class 12 Geography Chapter 2 Data Processing

NCERT Solutions for Class 12 Geography Chapter 2 Data Processing Read More »

NCERT Solutions for Class 12 Geography Chapter 1 Data: Its Source and Compilation

Detailed, Step-by-Step NCERT Solutions for Class 12 Geography Chapter 1 Data: Its Source and Compilation Questions and Answers were solved by Expert Teachers as per NCERT (CBSE) Book guidelines covering each topic in chapter to ensure complete preparation. https://mcq-questions.com/ncert-solutions-for-class-12-geography-chapter-1-part-c/

Data: Its Source and Compilation NCERT Solutions for Class 12 Geography Chapter 1

Data: Its Source and Compilation Questions and Answers Class 12 Geography Chapter 1

Question 1.
Choose the right answer from the four alternatives given below:
(i) A number or character which represents measurement is called …………
(a) Digit
(b) Data
(c) Number
(d) Character
Answer:
(b) Data

NCERT Solutions for Class 12 Geography Chapter 1 Data: Its Source and Compilation

(ii) A single datum is a single measurement from the …………
(a) Table
(b) Frequency
(c) Real world
(d) Information
Answer:
(a) Table

(iii) In a tally mark grouping by four and crossing fifth is called ………….
(a) Four and Cross Method
(b) Tally Marking Method
(c) Frequency plotting Method
(d) Inclusive Method
Answer:
(a) Four and Cross Method

(iv) An Ogive is a method in which ………..
(a) Simple frequency is measured
(b) Cumulative frequency is measured
(c) Simple frequency is plotted
(d) Cumulative frequency is plotted
Answer:
(d) Cumulative frequency is plotted

(v) If both ends of a group are taken in frequency grouping, it is called ………….
(a) Exclusive Method
(b) Inclusive Method
(c) Marking Method
(d) Statistical Method
Answer:
(d) Statistical Method

NCERT Solutions for Class 12 Geography Chapter 1 Data: Its Source and Compilation

Question 2.
Answer the following questions in about 30 words.

(i) Differentiate between data and information.
Answer:
Data can be any character, words, text, pictures, video etc. and if not put into context means little or nothing to a human. However information is useful and usually formatted in a manner that allows it to be understood by a human.

(ii) What do you mean by data processing?
Answer:
Data processing is, generally, the collection
and manipulation of items of data to produce meaningful information. In this sense it can be considered a subset of information processing.

(iii) What is the advantage of footnote in a table?
Answer:
Advantages of footnote

  • Readers can quickly gance down the page to find out the source of the table they are looking at.
  • Additional information that cannot be put in the table can be given in the footnote.

(iv) What do you mean by primary sources of data?
Answer:
Data collected directly from the field by counting a phenomena or interviewing people is called primary data. The main source of primary data is field investigation.

(v) Enumerate five sources of secondary data.
Answer:
Five sources of secondary data are

  • Government Publications.
  • Semi/Quasi-government Publications.
  • International Publications.
  • Electronic Media.
  • Newspaper and Magazines.

NCERT Solutions for Class 12 Geography Chapter 1 Data: Its Source and Compilation

Question 3.
Answer the following questions in about 125 words:

(i) Discuss the national and international agencies where from secondary data may be collected.
Answer:
The secondary data are collected from national and international agencies. National agencies are—
1. Government Publications. The publications of various ministers and the departments of the government of India, state government and the district bulletins are one of the most important sources of secondary information. These include the census of India published by Register General of India, National Sample Survey, Weather Reports of Indian Meterological Department and Statistical Abstracts etc.

2. International Publications. The international publications comprise year book, reports and monographs published by different agencies of the United Nations such as UNESCO, WHO and other agencies.

(ii) What is the importance of an Index number? Taking an example examine the process of calculating an index number and show the changes?
Answer:
An index number is a statisical measure designed to show changes in variable or a group of related variables with respect to time, geographic location or other characteristic. It is to be noted that index numbers not only measure changes over a period of time but also compare economic conditions of different locations, industries, cities or countries.

NCERT Solutions for Class 12 Geography Chapter 1 Data: Its Source and Compilation

Index number is widely used in economics and business to see changes in price and quantity. There are various methods for the calculation of index number. Simple aggregate method is most commonly used. It is obtained using the following formula.
\(\frac{\sum q_{1}}{\sum q_{0}} \times 100\)
Eq 1= Total of the current year production.
Xq0 = Total of the base year production.
NCERT Solutions for Class 12 Geography Chapter 1 Data Its Source and Compilation 1

NCERT Solutions for Class 12 Geography Chapter 1 Data: Its Source and Compilation Read More »

NCERT Solutions for Class 12 Geography Chapter 11 International Trade

Detailed, Step-by-Step NCERT Solutions for Class 12 Geography Chapter 11 International Trade Questions and Answers were solved by Expert Teachers as per NCERT (CBSE) Book guidelines covering each topic in chapter to ensure complete preparation. https://mcq-questions.com/ncert-solutions-for-class-12-geography-chapter-11-part-b/

International Trade NCERT Solutions for Class 12 Geography Chapter 11

International Trade Questions and Answers Class 12 Geography Chapter 11

Multiple Choice Questions

Question 1.
Choose the right answers of the following from the given options.
(i) Trade between two countries is termed as :
(A) Internal trade
(B) External trade
C) International trade
(D) Local trade.
Answer:
(C) International trade.

NCERT Solutions for Class 12 Geography Chapter 11 International Trade

(ii) Which one of the following is a land locked harbour ?
(A) Vishakhapatnam
(C) Ennor
(B) Mumbai
(D) Haldia.
Answer:
(D) Vishakhapatnam.

(iii) Most of India’s foreign trade is carried
through :
(A) Land and sea
(B) Land and air
(C) Sea and air
(D) Sea.
Answer:
(C) Sea and air.

Question 2.
Answer the following questions in about 30 words.
(i) Mention the characteristics of India’s foreign trade.
Answer:

  • India’s foreign trade is continuously increasing
  • Most of India’s foreign trade is by sea,
  • India has unfavourable balance of trade
  • It has a share of 10% in world trade
  • In Import trade, the import of Petroleum products is increasing while in Exports, the export of manufactured goods is increasing

NCERT Solutions for Class 12 Geography Chapter 11 International Trade

(ii) Distinguish between Port and Harbour.
Answer:

HarbourPort
1.     A harbour is an area of sea providing safe en­trance to ships.
2.   it protects the ships from waves and storms.
3.  River, estuaries, bays provide natural harbours such as Mumbai.
4.   A harbour provides sufficient room for an­chorage of ships.
1.  A port is a point on the coast where ships can tie up for anchor.
2. Ships load and unload commodities here.
3. Indented  coasts provide natural ports.
4. A port is connected with a productive hinterland.

(iii) Explain the meaning of Hinterland.
Answer:
Hinterland is an area which is connected with the port by Rail-Road transportation. It provides raw materials for export while imports are distributed in this area.

(iv) Name important items which India imports from different countries.
Answer:
Petroleum and petroleum products are the major imports of India. Other imports include machinery, Non-metallic minerals, pearls and valuable gems, non-ferrous metals, pulp, paper, edible oil, fertilisers, etc.

(v) Name the ports of India located on the east coast.
Answer:
Kolkata, Haldia, Paradip, Vishakhapatnam, Ennore, Chennai, Tuticorin are the major ports on the east coast of India.

NCERT Solutions for Class 12 Geography Chapter 11 International Trade

Question 3.
Answer the following questions in aboutl50 words.
(i) Describe the composition of export and import trade of India.
Answer:
Imports. The major imports of India are:

  • Petroleum and petroleum products,
  • Machinery
  • Pearls-Gems
  • Gold-silver,
  • Chemical products
  • Fertilisers
  • Pulp-paper
  • Non-ferrous metals
  • Pulses.

Exports:

  • Engineering goods
  • Chemical products
  • Gems ornaments
  • Garments
  • Petroleum products
  • Agricultural products,
  • Electronic goods
  • Leather.

NCERT Solutions for Class 12 Geography Chapter 11 International Trade

(ii) Write a note on the changing’ nature of International trade of India.
Answer:

  • India’s international trade is continuously increasing.
  • The share of Agricultural and allied products is decreasing.
  • The imports of Petroleum products is increasing.
  • The exports of coffee, tea, spices is decreasing.
  • Export of fresh fruits, sugar has increased.
  • The share of manufactured goods has increased in exports.
  • The export of engineering goods has increased.
  • Share of Gems-pearls and ornaments in exports has increased.

NCERT Solutions for Class 12 Geography Chapter 11 International Trade Read More »

NCERT Solutions for Class 12 Geography Chapter 10 Transport and Communication

Detailed, Step-by-Step NCERT Solutions for Class 12 Geography Chapter 10 Transport and Communication Questions and Answers were solved by Expert Teachers as per NCERT (CBSE) Book guidelines covering each topic in chapter to ensure complete preparation. https://mcq-questions.com/ncert-solutions-for-class-12-geography-chapter-10-part-b/

Transport and Communication NCERT Solutions for Class 12 Geography Chapter 10

Transport and Communication Questions and Answers Class 12 Geography Chapter 10

Multiple Choice Questions

Question 1.
Choose the right answers of the following from the given options.
(i) In how many zones has the Indian Railways system been divided ?
(A) 9
(B) 12
(C) 16
(D) 14.
Answer:
(C) 16

NCERT Solutions for Class 12 Geography Chapter 10 Transport and Communication

(ii) On which river and between which two places does the National Water Way No. 1 lie ?
(A) The Brahmaputra, Sadiya-Dhubri
(B) The Ganga, Haldia-Allahabad
(C) West Coast Canal, Kottapuram to Kollam
Ans.
(B) The Ganga, Haldia-Allahabad

(iii) In which of the following year, the first radio programme was broadcast ?
(A) 1911
(B) 1936
(C) 1927
(D) 1923.
Answer:
(D) 1923.

Question 2.
Answer the following questions in about 30 words.
(i) Which activity does transportation convey ? Name three major modes of transportation.
Answer:
Transport is a tertiary activity. The three major modes of transportation are aviation, land transport, which includes road, rail and off-road transport, and ship transport.

NCERT Solutions for Class 12 Geography Chapter 10 Transport and Communication

(ii) Discuss the advantages and dis¬advantages of pipeline transportation.
Or
“Pipelines have become the most convenient and efficient mode of transporting liquids and gases over long distances in India.” Supports the statement with examples. (Delhi 2019)
Answer:
Pipelines are the most convenient mode of transport for any liquid goods like petroleum and gas. It is a cheap means of transport and can be laid through difficult terrains, dense forests, deserts and high mountains. It involves low energy consumption. ( Transport and Communication ) But it has more disadvantages in comparison with advantages.

Its disadvantages are:

  • It is not flexible.
  • Its capacity cannot be increased once ‘it is laid’.
  • Maintaining the security of pipeline is difficult.
  • Underground pipes cannot be repaired easily.
  • The detection of leakage is also difficult.

(iii) What do you mean by communication?
Answer:
Communication is an activity of conveying information through the exchange of thoughts, messages or information by speech, visual, writing or behaviour.

NCERT Solutions for Class 12 Geography Chapter 10 Transport and Communication

(iv) Discuss the contribution of Air India and Indian Airlines in air transport of India.
Answer:
Air transport is the fastest and costliest mode of transport. It has two units-Air India and Indian. For India, this mode of transport is important because of its large size and planned economic development. Large industrial and commercial centres are located at great distances, which require fast transport links.

Further, air transport is also vital for linking India with other countries. The Airport Authority of India is responsible for providing safe, efficient air traffic and aeronautical communication services in the Indian air space. The authority manages 24 international and 85 domestic airports including 28 passenger terminals at defence airfields.

Question 3.
Answer the following questions in about 150 words.
(i) What are the chief means of transportation in India? Discuss the factors affecting, their development.
Answer:
The main means of transportation on land, water and air are :

  • Railways,
  • Roadways,
  • Airways,
  • Waterways and
  • Pipelines.

NCERT Solutions for Class 12 Geography Chapter 10 Transport and Communication

The following factors affect the development of means of transport in India :
1. Physical factors. Railways and Roadways have developed in the Northern plains. The hilly areas have sparse railways as in Assam and Himalayas.

2. Economic factors. Railways and Roads connect industrial commercial towns and ports: Rajasthan due to low economic development has less railways.

3. Political factors. The British policy was to exploit Indian resources. So ports were connected with hinterlands.

(ii) Give a detailed account of the develop¬ment of railways in India and highlight their importance.
Answer:
India is a land of diverse culture and Indian Railways play a key role in not only meeting the transport needs of the country but also binding together dispersed areas and promoting national integration. Indian Railways has been the prime movers to the nation and has the distinction of being one of the largest railway systems of the world under a single management.

Railways being the more energy efficient mode of transport are ideally suited for the movement of bulk commodities and for long distance travel. As compared to road transport, the railways has a number of intrinsic advantages. Railways are five to six times more energy efficient, four times more efficient in land use and significantly superior from the standpoints or environment impact and safety.

Railways being the prime infrastructural sector of the country needs to expand and develop to keep pace with the growth of Indian economy. The massive investment needed for the development of the railway system has not been fully available

NCERT Solutions for Class 12 Geography Chapter 10 Transport and Communication

Railways traverse through the length and breadth of the country covering 63,140 route kms as on 31.3.2002, comprising broad gauge (45,099 kms), meter gauge (14,776 kms) and narrow gauge (3.265 krns). As the principal constituent of the nation’s transport system, Indian Railways own a fleet of 2,16,717 wagons (units), 39,236 coaches and 7,739 number of locomotives and manage to run 14,444 trains daily, including about 8,702 passenger trains. They carry more than a million tonne of freight traffic and about 14 million passengers covering 6,856 number of stations daily.

Railways have to perform the dual role of commercial organization ad vehicle for fulfillment of social obligations. In national emergency, railways have been in the forefront in rushing relief material to disaster stricken regions. The Indian Railway system is managed through zones and operating divisions. There are also six production units engaged in manufacturing rolling stock, wheels and axles and other ancillary components to meet Railways’ requirements.

(iii) Describe the role of roads in the economic development of India.
Answer:
In India, the growing importance of road transport vis-a-vis rail transport is rooted in following reasons:

  • Construction cost of roads is much lower than that of railway lines;
  • Roads can traverse comparatively more dissected and undulating topography;
  • Road transport can economically carry few persons and relatively small amount of goods.
  • Cost of loading and unloading is much lower in case of road transport, because it provides door-to-door service.
  • Road transport also supplements the other modes of transportation. It provides link between 32railway stations and airports and their hinterlands.

NCERT Solutions for Class 12 Geography Chapter 10 Transport and Communication

NCERT Solutions for Class 12 Geography Chapter 10 Transport and Communication Read More »

error: Content is protected !!