These NCERT Solutions for Class 8 Maths Chapter 5 Data Handling InText Questions Questions and Answers are prepared by our highly skilled subject experts.
NCERT Solutions for Class 8 Maths Chapter 5 Data Handling InText Questions
Try These (Page No. 71)
Question 1.
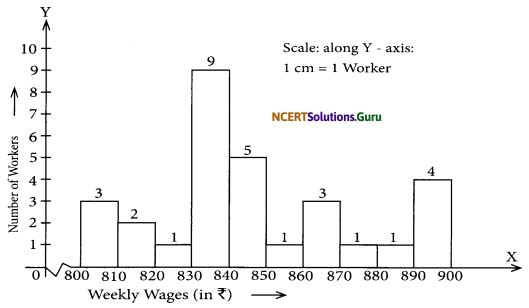
Draw an appropriate graph to represent the given information.


Solution:
(i) Note: A bar graph showing two sets of data simultaneously is called a double-bar graph. It is useful for the comparison of the data.

To represent the given data by a bar- graph, draw two axes perpendicular to each other. Now, represent ‘Months’ on OX and ‘Number of watches sold’ on OY. Erect recharge of the same width. The heights of the rectangles are proportional to the number of watches using a suitable scale:
Here, the scale is 1 cm = 500 watches
Since 500 watches = 1 cm
1000 watches = 2 cm
1500 watches = 3 cm
2000 watches = 4 cm
2500 watches = 5 cm

(ii)

(iii) Since, a comparison of two activities (walking and cycling) is to be represented, there a double-graph is drawn by taking the schools along the x-axis and the number of children on the y-axis, using a scale of 1 cm = 5 children.

To compare the percentage win in ODI achieved by various teams, we represent the data by a double-bar graph. We represent the teams along the x-axis and their percentage win along the y-axis, using the scale 1 cm = 5%.
Try These (Page No. 72)
Question 2.
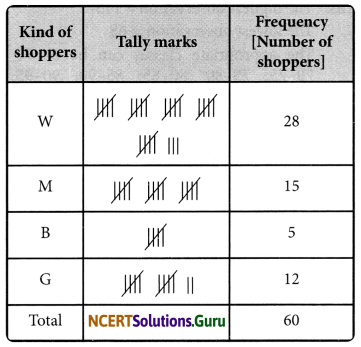
A group of students was asked to say which animal they would like most to have as a pet. The results are given below:
dog, cat, cat, fish, cat, rabbit, dog, cat, rabbit, dog, cat, dog, dog, dog, cat, cow, fish, rabbit, dog, cat, dog, cat, cat, dog, rabbit, cat, fish, dog.
Make a frequency distribution table for the same.
Solution:
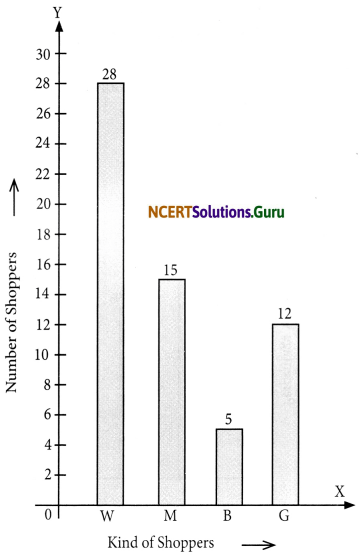
Using tally-marks, we have:

Try These (Page No. 73-74)
Question 3.
Study the following frequency distribution table and answer the questions given below.
Frequency Distribution of Daily Income of 550 workers of a factory
Table 5.3

(i) What is the size of the class intervals?
(ii) Which class has the highest frequency?
(iii) Which class has the lowest frequency?
(iv) What is the upper limit of the class interval 250 – 275?
(v) Which two classes have the same frequency?
Solution:
(i) Class size = (Upper class limit) – (Lower class limit)
= 125 – 100
= 25
(ii) The class 200 – 225 is having the highest frequency (which is 140).
(iii) The class 300 – 325 is having the lowest frequency (which is 20).
(iv) The upper limit of the class interval 250 – 275 is 275.
(v) The classes (150 – 175) and (225 – 250) are having the same frequency (which is 55).
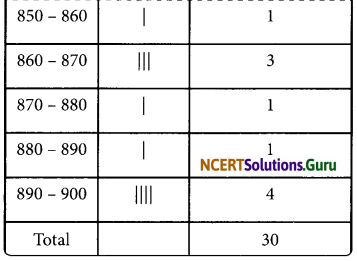
Question 4.
Construct a frequency distribution table for the data on weights (in kg) of 20 students of a class using intervals 30 – 35, 35 – 40, and so on.
40, 38, 33, 48, 60, 53, 31, 46, 34, 36, 49, 41, 55, 49, 65, 42, 44, 47, 38, 39.
Solution:
Lowest observation = 31
Highest observation = 65
Class intervals: 30 – 35, 35 – 40, 40 – 45,…..
The frequency distribution table for the above data can be:

Try These (Page No. 75)
Question 5.
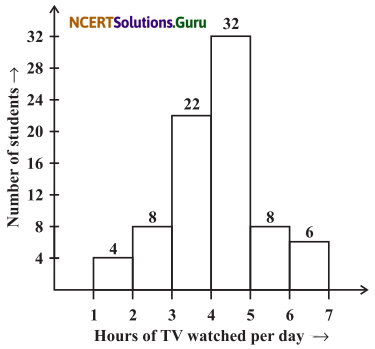
Observe the histogram (Fig 5.3) and answer the questions given below.

(i) What information is being given by the histogram?
(ii) Which group contains maximum girls?
(iii) How many girls have a height of 145 cm and more?
(iv) If we divide the girls into the following three categories, how many would there be in each?
150 cm and more – Group A
140 cm to less than 150 cm – Group B
Less than 140 cm – Group C
Solution:
(i) The above histogram represents the height (in cms) of girls of Class VIII.
(ii) The group 140 – 145 contains a maximum number of girls (which has as many as 7 girls).
(iii) 7 girls (= 4 + 2 + 1) have a height of 145 cm and more.
(iv) Number of girls in
Group A: 150 cm and more = 2 + 1 = 3 girls
Group B: 140 cm to less than 150 cm = 7 + 4 = 11 girls
Group C: Less than 140 cm = 1 + 2 + 3 = 6 girls.
Note: The broken line (~) is used along the horizontal line to indicate that we are not showing the numbers between 0 and 125.
Try These (Page No. 78)
Question 6.
Each of the following pie charts (Fig 5.5) gives you a different piece of information about your class.
Find the fraction of the circle representing each of this information.

Solution:
(i) Fraction of the circle representing the ‘girls’ 50% = \(\frac{50}{100}=\frac{1}{2}\)
Fraction of the circle representing the ‘boys’ 50% = \(\frac{50}{100}=\frac{1}{2}\)
(ii) Fraction of the circle representing ‘walk’ 40% = \(\frac{40}{100}=\frac{2}{5}\)
Fraction of the circle representing ‘but or car’ 40% = \(\frac{40}{100}=\frac{2}{5}\)
Fraction of the circle representing ‘cycle’ 20% = \(\frac{20}{100}=\frac{1}{5}\)
(iii) Fraction of the circle representing those who live mathematics = (100 – 15)%
= \(\frac{100-15}{100}\)
= \(\frac{85}{100}\)
= \(\frac{17}{20}\)
Fraction of the circle representing those who hate mathematics = 15%
= \(\frac{15}{100}\)
= \(\frac{3}{20}\)
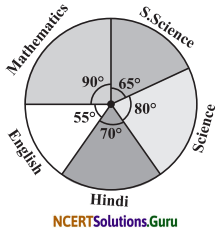
Question 7.
Answer the following questions based on the pie chart given.
(i) Which type of programmes are viewed the most?
(ii) Which two types of programmes have a number of viewers equal to those watching sports channels?

Solution:
From the given pie chart, we have: Obviously,

(i) The entertainment programmes are viewed the most.
(ii) The news and informative programmes have an equal number of viewers.
Try These (Page No. 81)
Question 8.
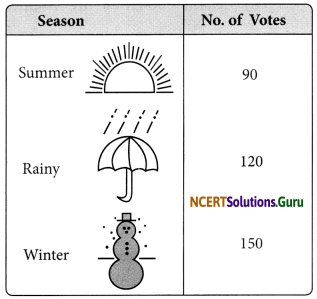
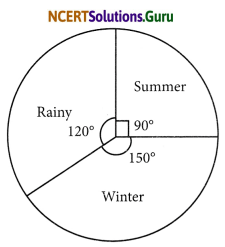
Draw a pie chart of the data given below.
The time spent by a child during a day.
Sleep – 8 hours
School – 6 hours
Homework – 4 hours
Play – 4 hours
Others – 2 hours
Solution:
First, we find the central angle corresponding to the given activities.

Now, the required pie chart is given below:

Try These (Page No. 83)
Question 9.
If you try to start a scooter, what are the possible outcomes?
Solution:
It may start. It may not start.
Question 10.
When a die is thrown, what are the possible outcomes?
Solution:
The possible outcomes are 1, 2, 3, 4, 5, or 6.
Question 11.
When you spin the wheel shown, what are the possible outcomes? List them.
(Outcome here means the sector at which the pointer stops).

Solution:
The possible outcomes are A, B, or C.
Question 12.
You have a bag with five identical balls of different colours and you are to pull out (draw) a ball without looking at it; list the outcomes you would get.

Solution:
The possible outcomes are W, R, B, G, or Y.